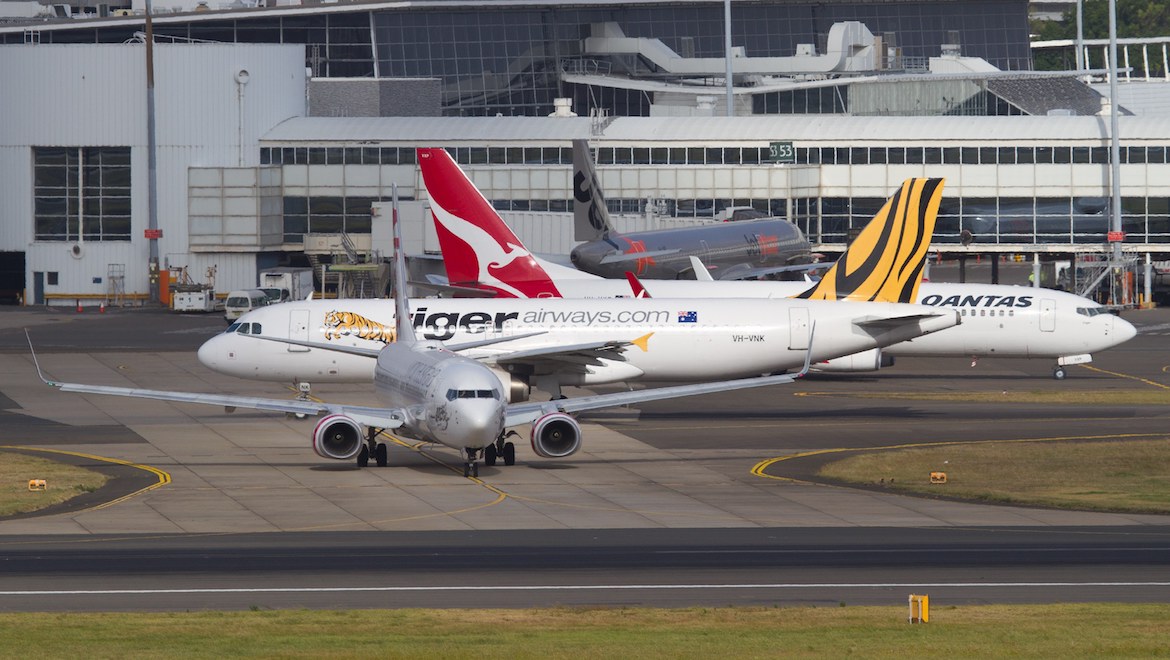
The proportion of scheduled domestic passenger services departing on time hit a 12-month high of 84.7 per cent in May, figures from the Bureau of Infrastructure, Transport and Regional Economics (BITRE) show.
Cancellations were also relatively low at 1.8 per cent of flights.
BITRE said the May on-time departure result was better than the long-run average of 83.8 per cent.
The on-time arrivals rate of 83.5 per cent in May also bettered the long-run average of 83.8 per cent. However, the cancellation rate was worse than the long-run benchmark of 1.5 per cent.
Although the best for a year, the figure for on-time departures was consistent with the seasonal pattern: May was typically a good month for punctuality.
The May 2019 figures were in fact worse than May 2018, when 85.0 per cent of flights left on time.
May 2018 was in turn worse than both May 2017 with an 87.4 per cent on-time rate, and May 2016, which had 88.4 per cent of departures on time.
This means that a flight scheduled in May 2019 was 32 per cent more likely to be cancelled than three years earlier.
Of the major domestic airlines, Virgin Australia had the highest on-time departure rate in May, at 86.2 per cent, with Tigerair Australia at the bottom of the list for the seventh month in a row with 77.2 per cent.
Of the regional airlines, Regional Express was most punctual, with 87.8 per cent for on-time departures.
Qantas recorded the highest percentage of cancellations (2.8 per cent) during the month, with QantasLink racking up the highest cancellation rate among the regionals. The best of the majors was Jetstar at 0.7 per cent, although Regional Express was the best overall at just 0.6 per cent.
Although in the middle of the pack with a cancellation rate of 1.8 per cent, Tigerair Australia has managed a notable turnaround after averaging 4.5 per cent in the year to April, which included a peak of 8.8 per cent in January.
BITRE noted in its monthly report there was some variance between the airlines in terms of data collection. Jetstar and Qantas jet services use Aircraft Communication Addressing and Reporting System (ACARS) to electronically measure performance, with other Qantas services and non-Qantas carriers collected data manually from pilots, gate agents and/or ground crew.
| Sectors | Arrivals on time | Departures on time | Cancellations | |||||
| Scheduled | Flown | No. | % | No. | % | No. | % | |
| Jetstar | 6313 | 6270 | 5264 | 84 | 5191 | 82.8 | 43 | 0.7 |
| Qantas | 9385 | 9126 | 7623 | 83.5 | 7764 | 85.1 | 259 | 2.8 |
| QantasLink | 10680 | 10479 | 8731 | 83.3 | 8790 | 83.9 | 201 | 1.9 |
| Regional Express | 6590 | 6548 | 5548 | 84.7 | 5747 | 87.8 | 42 | 0.6 |
| Tigerair Australia | 2211 | 2171 | 1642 | 75.6 | 1676 | 77.2 | 40 | 1.8 |
| Virgin Australia | 11793 | 11540 | 9746 | 84.5 | 9942 | 86.2 | 253 | 2.1 |
| VA Regional Airlines | 847 | 837 | 650 | 77.7 | 694 | 82.9 | 10 | 1.2 |
| All Airlines | 47819 | 46971 | 39204 | 83.5 | 39804 | 84.7 | 848 | 1.8 |
| All Qantas designated | 20065 | 19605 | 16354 | 83.4 | 16554 | 84.4 | 460 | 2.3 |
| All Virgin Australia designated | 12640 | 12377 | 10396 | 84 | 10636 | 85.9 | 263 | 2.1 |
Source: BITRE


